| |
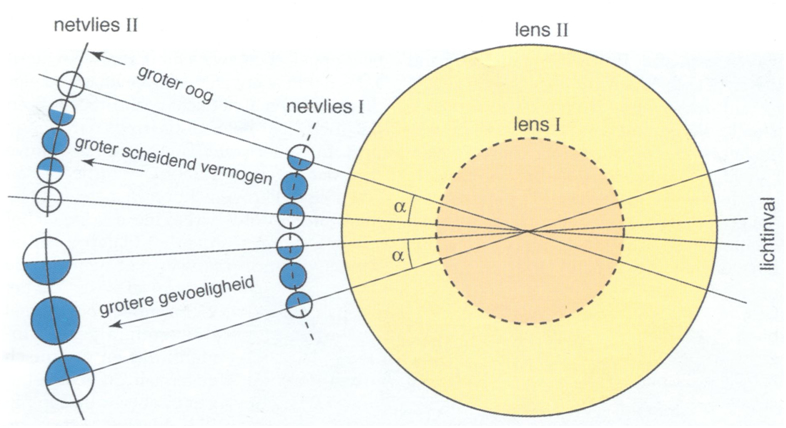
Every sense organ, including the eye, is characterized by its capacity to detect detail (resolution) and by a threshold-value of the weakest incoming stimulus registered (sensitivity). Retinal resolution and sensitivity are functionally connected to density and size of visual unit and therefore compete with each other for available space. Retinal growth occurs by adding new neurons including cones from the retinal margin and by increasing cell size (cone size). Only rods increase their number throughout the retina in between the other neurons. As a consequence, both resolution and sensitivity increase during growth, even though cone density decreases. Sometimes, specific cone types may benefit from an improved packing. For instance, single cones may degenerate after which the liberated space comes available to the double cones.
Structural parameters
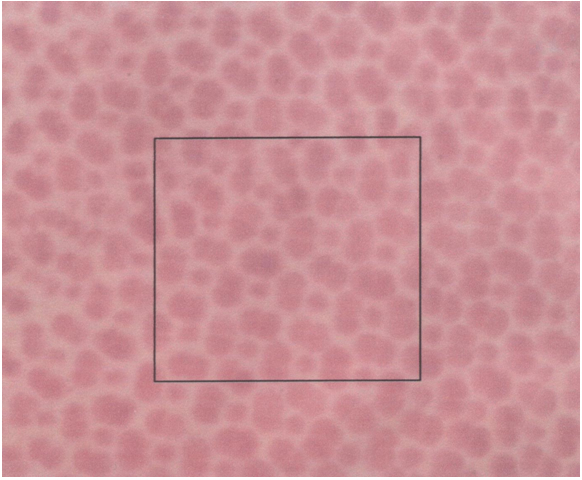
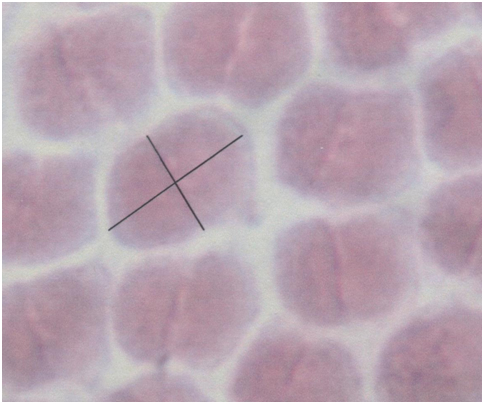
The size of the double cones (Sd) and of the single cones (Ss) can be derived from tangential sections through the retina at the level of the cone photoreceptors by measuring the areas of their cross-sectional inner sections (ellipsoids). Planimetric cone density can be derived from the same tangential sections by counting the number of cones per unit area (Dd) or single cones per unit area (Ds). The angular density of the double cones (Hd) is the number of double cones per degree of visual angle. It is derived from the planimetric density as:
 (1) (1)
Where i is the image-distance (the distance between the centre of the eye-lens and the photoreceptor layer). The image-distance as a function of the lens-radius is often taken as the mean value of 2,5 . r (r = lens radius) conforming to Matthiesen’s ratio (Sivak, 1990).
The packing of the cones (Z), viz. the fraction retinal area occupied by cones, can be calculated by multiplying the planimetric cone density by cone size and is expressed as the percentage occupied retinal area.
In transverse sections of the retina the number of nuclei of retinal neurons (rods, cones, intermediate cells, ganglion cells) can be counted in a number of field of a specific length throughout a section in various areas of the retina (dorsal, ventral, caudal, rostral). The planimetric neuron densities (D) can then be calculated using:
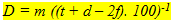 (2) (2)
where m is the number of nuclei per field, t is the thickness of the section, d is the approximate diameter of the concerned nuclei and f is the thickness of the smallest fragments of recognized nuclei with an estimated value of f = 0,25 d. All planimetric densities are presented as numbers of cells per 0,01 mm2.
Comparability
Quantitative comparison of retinal structures is hampered by differences in eye-size and intra-retinal variability. Inter-retinal comparison is usually based on the mean values of the structural parameters collected from a range of similar locations in each retina. Clear correlations within each species between eye-size and structural parameters facilitate interspecific comparison by using regression analysis. To test significance of interspecific differences of structural features, multiple regression analyses is carried out using dummy variables to indicate the different species (Kleinbaum & Kupper, 1978).
For simple presentation of interspecific comparison, specimens with eyes of equal size would be most convenient. As such material is hardly available, linear regression has been applied to estimate the structural data for all species at a specific lens radius (r), usually of 1,40 mm.
Visual resolution
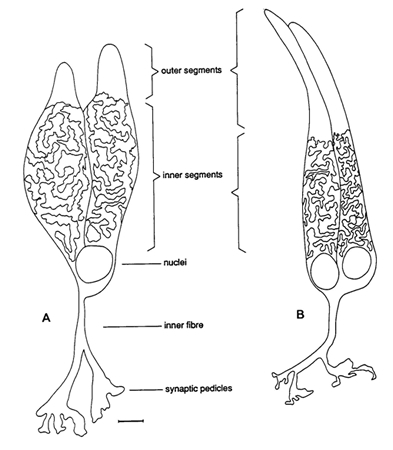
At a given eye-size, the best possible resolution is constrained by the distance between the cones. However, the cones are not similar: there are single cones and double cones, and they contain three different visual pigments (Bowmaker, 1995). There is also a certain degree of convergent and divergent connections between the cones and the postsynaptic cells (Wagner, 1990), suggesting a number of interacting cones involved in a photopic unit. The total number of cones involved in such a photopic unit may be influenced by the light conditions, but has most certainly a minimum value.
The resolution expressed as the minimum separable angle a can be given as a function of the angular density of the double cones according to:
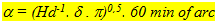 (3) (3)
where d represents the (minimum) number of double cones per photopic unit. Otten (1981) proposed a unit size of 5 cones (two double cons + one single cone). Van der Meer (1995) started from the same unit size but considered a certain degree of divergence that reduced d from 2 to 0,5 due to overlapping receptive fields.
Sensitivity
Sensitivity is mend here as threshold values. It is associated with the photon catching ability and the degree of convergence of the receptor cells. At low light levels, the degree of convergence of the rods to postsynaptic cells plays a prominent role in the detection of photons (Lythgoe, 1979). The more the rods converge to one ganglion cell the larger the receptive field of the scotopic unit and the lower the scotopic threshold becomes. The ratio between rods and ganglion cells (Cr) can be taken as a comparative measure for scotopic sensitivity, following Cr1 / Cr2 when comparing species 1 and 2.
At higher light levels the rods are screened off from the incoming light and the photopic system becomes effective. The similarity in retinal architecture among the haplochromine cichlids suggests the same degree of cone convergence in the closely related species. In a comparative way the photon catching ability is of major importance. The photon catching ability of individual cones depends on their size and the properties of their visual pigments. With respect to the spectral sensitivity, one can distinguish between the short wave sensitive single cones and the medium/long wave sensitive double cones.
The size of the cones is taken as a comparative determinant for the photopic thresholds. The inner segments of the cone cells contain high concentrations of mitochondria. This influences the refractive index of the cells in comparison with their surrounding as such that the cones can be regarded as wave guides (Snyder, 1975). Besides, the amount of mitochondria can be understood as an indication for the amount of visual pigment in the outer segments. Photon catching ability is therefore best presented by the content of the cones that compose a photopic unit (Vc), according to:
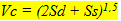 (4) (4)
Both resolution and photon catching ability can be improved by maximizing the spatial occupation of the receptors, which is expressed as the packing (Z). So maximization of the packing is a mean to optimise optical functions.
|
|
|