| |
When the juvenile cichlid has consumed its yolk sack and depends foodwise entirely on catching prey, its standard-length approximately equals the eye-length of an adult. In other words, the eyes grow enormously and with it the cells of the retina. All retinal neurons are formed as new cells along the retinal margin with the exception of the rod photoreceptors; they emerge throughout retinal growth between the cone photoreceptors (Otten, 1981; Noakes & Godin, 1988; Powers & Raymond, 1990).
During growth, there is an absolute increase of retinal neurons (by mitosis) and of their size (by cell growth). Moreover, the eyes grow without changing proportions (isometric) and the lens becomes larger as well. These enlargements are inseparable from visual abilities. An increase of photoreceptors per visual angle may serve acuity only if the measure of convergence does not increase in a similar way. Such a convergence may serve sensitivity just like an enlargement of the wave-guiding cone ellipsoids would (van der Meer & Anker, 1984).
The present study is restricted to the ontogenetic development of the eye and retina of the molluscivore H. sauvagei from free swimming juveniles to adult specimens.
Procedure and histology
Periodically, a few specimens of originally free swimming fry, were killed with MS222 (Sandoz) 1% and preserved in formalin 10%. After measuring the standard length (SL) and the lens diameter, isolated eyes or, in the case of small fishes (SL < 2 cm), whole specimens were embedded in paramat and cross sections (3 mm) in a dorsad-ventrad direction were made through the centre of the eyes. With the exception of the smaller eyes (lens radius < 0,5 mm), tangential sections (5 mm) were also made using a location-device with independent axial and radial mobility to determine the original position of the sections (for details see Van der Meer & Anker, 1986). This technique enables to collect data from similar retinal locations, which allows inter-retinal comparison through mean values. All sections were stained with heamalum and eosine. Counts of cells and nuclei were made using an eye-piece micrometer mounted on an Olympus microscope with an oil-immersion objective at a magnification of 1000x.
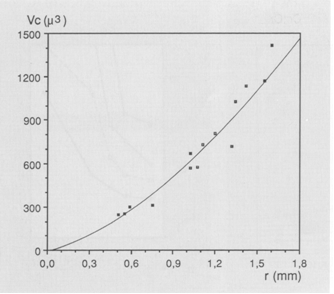
The size of either a double cone (Sd) or a single cone (Ss) was derived from the tangential sections and calculated from the elliptic and circular shape of the cross section through its inner segment. The area of a photopic unit (Ac) comprising two double cones and one single cone (Otten, 1981) then equals 2Sd + Ss. The planimetric cell density (D) was obtained directly from the number of cells per unit area in the tangential sections, or derived indirectly from the number of nuclei in the cross sections. For that purpose the number of nuclei of retinal neurons was counted in one to five fields (depending on the eye-size) of 50 mm length at the outer limiting membrane in the dorsal, medial and ventral part of each cross section. Planimetric densities (number . 0,01 mm-2) were then calculated as described in Van der Meer & Anker (1986) using:

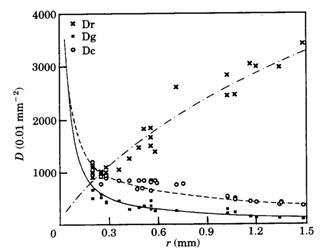
where m is the number of nuclei per field, t is the thickness (mm) of the section, d is the approximate diameter (mm) of the concerned nuclei and f is the thickness (mm) of the smallest fragments of nuclei recognized and counted and which has an estimated value of f = d/4. The planimetric densities include the density of ganglion cells (Dg), of rods (Dr), of cones (Dc; a double cone includes two cones) and of double cones (Dd). Since retinal thickness remains rather constant compared to retinal curvature during growth, the used field length of 50 mm would include a significantly different retinal area depending on the position (scleral/vitreal) of the considered retinal layer. With the outer limiting membrane as a reference a correction was applied using:

where l’ is the field length (mm) of the inner (ganglion cell) layer, l is the field length (mm) of the outer limiting membrane, v the distance (mm) between the inner layer an the outer limiting membrane and 2,55.r the image distance (r is lens radius (mm) and 2,55 is Matthiessen’s ratio).
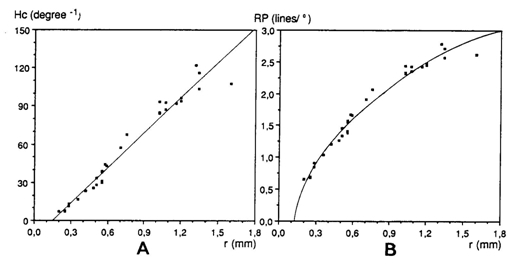
The angular density of the cones (Hc) was calculated using:

where r is the lens radius (mm), 2,55 is Matthiessen’s ratio (mean ratio between image distance and lens radius) and Dc is the planimetric cone density.
If the photopic unit coincides with a photopic unit comprising five cones, the resolution of the photopic system (RP) can be calculated adapting the formula given by Van der Meer & Anker (1984) to express resolving power as a function of Hc:

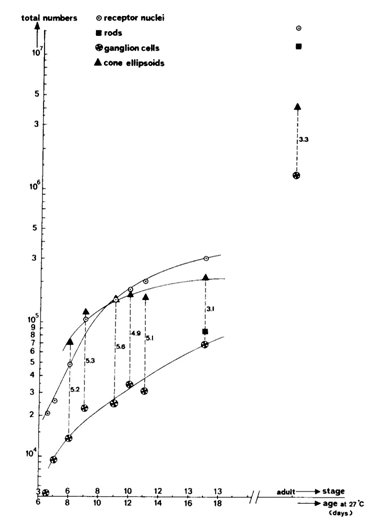
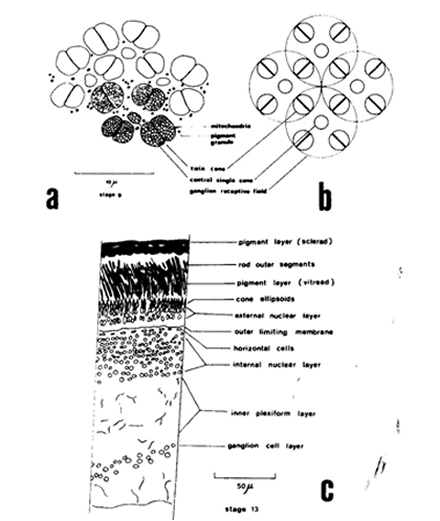
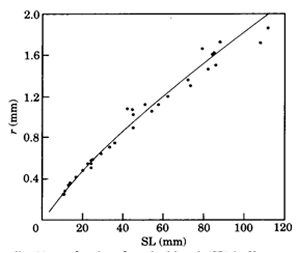
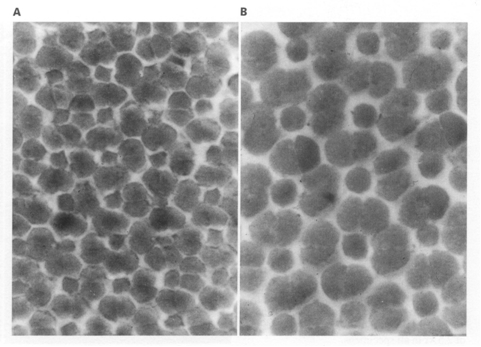
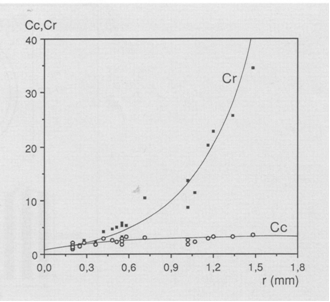
During postbuccal growth of H. sauvagei over a size range of 1 to 11 cm SL, the lens radius (proportionally related to eye size) increased more than seven times. Simultaneously, retinal growth was attended by an increasing angular density (number/visual angle) of the photoreceptors and postsynaptic cells (e.g. ganglion cells) and by an enlargement of the cross-sectional areas of the cone photoreceptors. This enlargement held for both double and single cones, which were regularly arranged in a square mosaic: one single cone surrounded by four double cones. The planimetric density (number/retinal area) of the cones and postsynaptic cells like ganglion cells decreased during growth. Their mutual ratio remains approximately similar as in H. elegans, i.e. 1 : 3 (Otten, 1981). Accordingly, the concept of a photopic unit of 5 cones is supported and considered to be a general phenomenon in all haplochromines. The extra ganglion cells are assumed to be connected to the increasing numbers of rod photoreceptors. The scotopic unit measures an increasing convergence and will therefore become more sensitive during growth.
The increasing planimetric density of rods requires an enlargement of the intracellular space between the cones and/or a diminution of the rod diameter. The rod density also increases in growing perch Perca fluviatilis (Guma’a, 1982) and goldfish Carassius auratus (Johns, 1981). However, it remains constant in other species like the guppy Poecilia reticulata (Müller, 1952), the crucian carp Carassius carassius (Kock, 1982) and the cichlid Haplochromis burtoni (Fernald, 1985). These examples suggest that increasing rod density is the result of evolutionary convergence rather than a phyletically determined feature.
|
|
|